
Reports
Moves, revenue, the quote funnel, sources, suburbs, quote accuracy and promo codes for any date range.
Reports at /roo/reports show how the business is going over any period: how many moves, how much revenue, how many quotes became bookings, which marketing works and how accurate your quotes are.
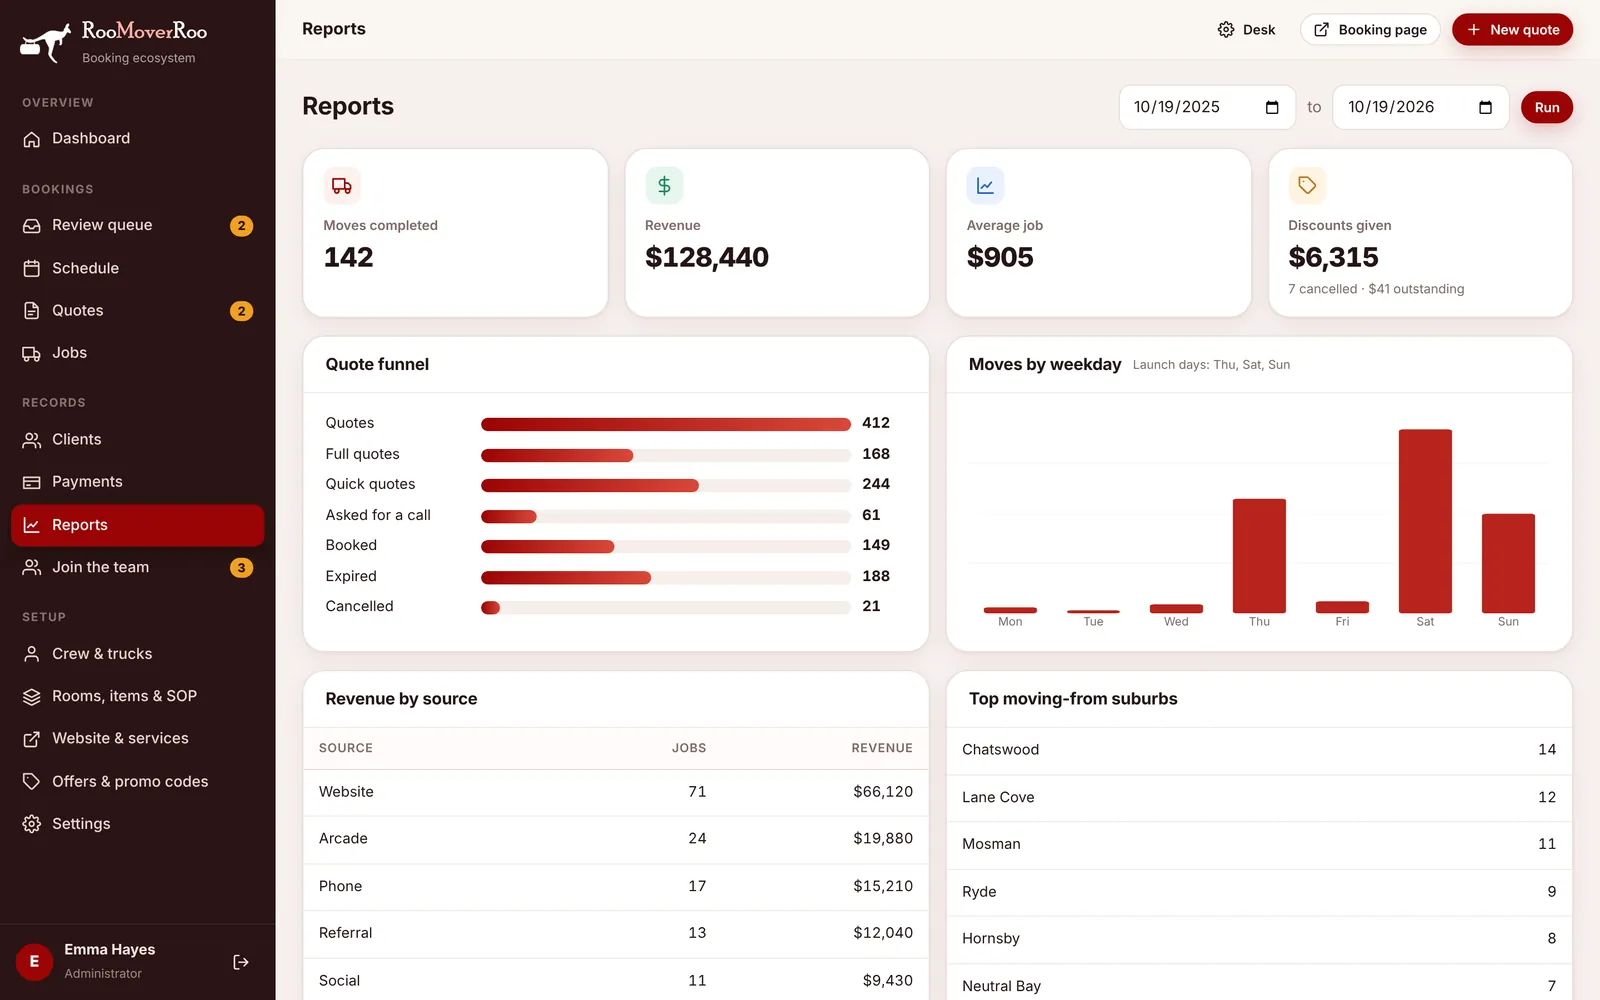
Choose a period#
Pick the start and end dates at the top and press Run. The report opens on the last 12 months.
What’s in the report#
| Part | What it shows |
|---|---|
| Totals | Moves completed, Revenue, Average job, and Discounts given, with the number of cancelled jobs and the amount still outstanding. |
| Quote funnel | Quotes made, how many were Full and Quick, how many asked for a call, how many booked, expired and were cancelled. |
| Moves by weekday | Which days of the week your moves fall on. |
| Revenue by source | Revenue from each lead source, such as Website, Arcade, Phone or Referral. |
| Top moving-from suburbs | Where your clients are moving from. |
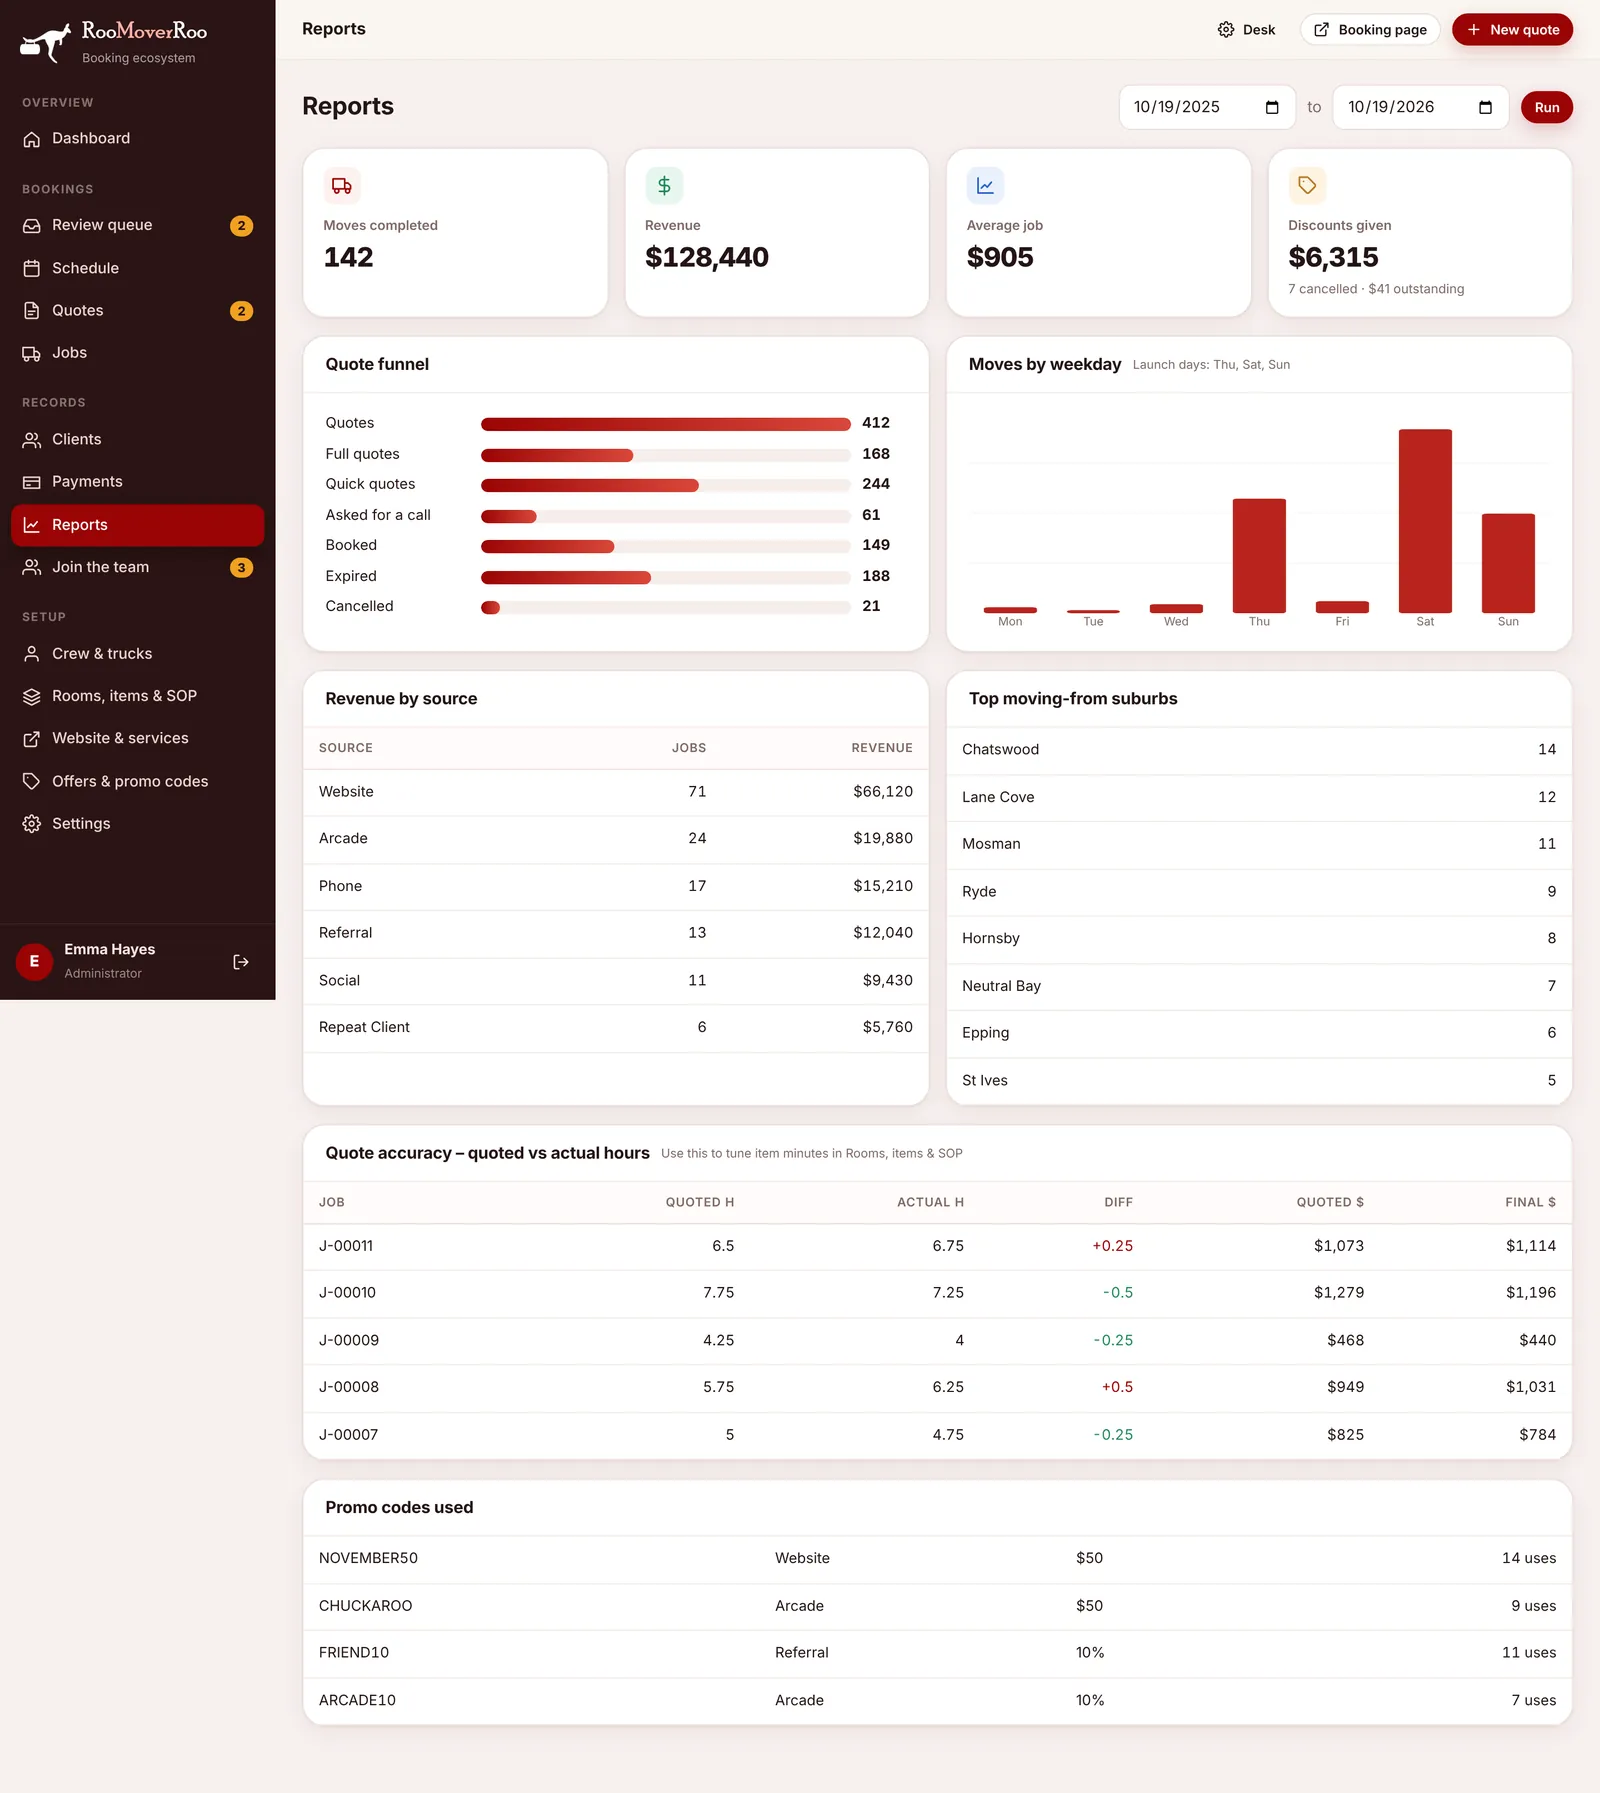
| Quote accuracy – quoted vs actual hours | For each completed job, the quoted hours, the actual hours and the difference: red when the job took longer than quoted, green when it was quicker. |
| Promo codes used | Which codes were used and how often. |
Tune your quotes#
Quote accuracy tells you whether your item times are right. If jobs keep running over, the handling minutes in the catalogue are too low; if they keep finishing early, they’re too high. Adjust them in Rooms and items, as the note under the table says: “Use this to tune item minutes in Rooms, items & SOP”.